Professional indicators for investors and tradersПрофессиональные индикаторы для инвесторов и трейдеров

Less market noise. More accuracy.Меньше рыночного шума. Больше точности.

METIS is a set of professional indicators designed for trading Bitcoin and other cryptocurrencies. For traders and investors. Tested on historical data, based on real-world experience, and supported directly by the developer.METIS — набор профессиональных индикаторов, созданных для торговли Биткоином и другими криптовалютами. Для трейдеров и инвесторов. Проверены на исторических данных, основаны на реальной практике и поддерживаются лично разработчиком.

Private Indicators · 12-Month Access · Pay with CryptocurrencyПриватные индикаторы · Доступ на 12 месяцев · Оплата криптовалютой

BTCUSDT · 1H $98,420 ▲
METIS chart preview
Live signalСигнал
17+ 17+
Indicators in the suite Индикаторов в наборе
100% 100%
Backtested on real data Протестировано на реальных данных
1:1 1:1
Support and assistance with setup Поддержка и помощь в настройке
12 12
Months of updates included Месяцев обновлений включено
Why METIS IndicatorsПочему METIS Indicators

For those who take investing and trading seriously. No unnecessary fuss.Для тех, кто инвестирует и торгует серьёзно. Без лишнего шума.

Every indicator is based on clear logic and transparent operation. You can see how signals are generated, verify the results yourself on your charts, and customize the indicator to fit your strategy.В основе каждого индикатора — понятная логика и прозрачная работа. Вы видите, как формируются сигналы, можете самостоятельно проверить результаты на своих графиках и настроить индикатор под свою стратегию.

Testing on historical dataТестирование на исторических данных

The logic behind the indicators is tested against actual price movements, rather than being tailored to a single favorable section of the chart or a nice-looking screenshot.Логика индикаторов проверяется на реальном движении цены, а не подгоняется под один удачный участок графика или красивый скриншот.

Real-Time SignalsСигналы в реальном времени

The signal is generated the moment the conditions are met and is not redrawn after it appears on the chart.Сигнал формируется непосредственно в момент выполнения условий и не перерисовывается после появления на графике.

Personal support from the developerЛичная поддержка разработчика

Direct access to the indicator author for configuration, answers to your questions, and fine-tuning to suit your trading style. You communicate directly with the developer, with no middlemen.Прямой доступ к автору индикаторов для настройки, ответов на вопросы и тонкой доводки под вашу торговлю. Вы общаетесь напрямую с разработчиком, без посредников.

All updates at no extra chargeВсе обновления без доплат

During your one-year subscription, you'll have access to all new METIS indicators and updates released during that period.В течение годовой подписки вы получаете доступ ко всем новым индикаторам и обновлениям METIS, которые выходят за этот период.

The SuiteНабор

More than 17 indicators – a unified systemБолее 17 индикаторов – единая система

Each tool serves a specific purpose. Use the indicators individually or combine them into a single workflow across different time frames.Каждый инструмент решает конкретную задачу. Используйте индикаторы по отдельности или объединяйте их в единый рабочий процесс на разных таймфреймах.

BTC Buy Zone signalsignal

BTC Buy ZoneBTC Buy Zone

The Best Place to Buy BitcoinЗона для выгодных покупок Биткоина

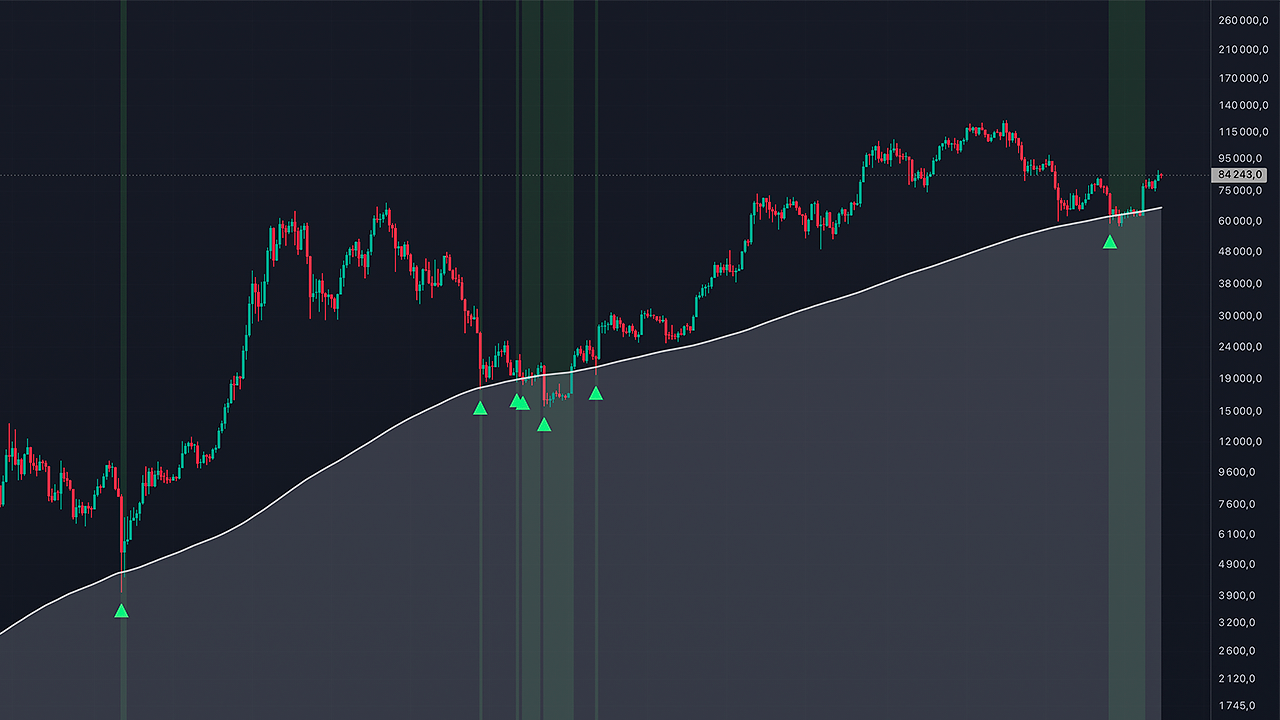
The indicator highlights an area on the chart where, historically, attractive conditions have emerged for building a long-term position in Bitcoin. It helps assess the current price in the context of the market and identify moments when gradual investing may be most advantageous.Индикатор выделяет на графике зону, в которой исторически формировались привлекательные условия для долгосрочного набора позиции в Биткоине. Помогает оценивать текущую цену в контексте рынка и находить моменты, когда постепенное инвестирование может быть наиболее интересным.

  • Buy Signals Индикация сигналов на покупку
  • Highlighting the area when a signal is detected Подсветка области при появлении сигнала
  • Adaptive smoothing for volatility Адаптивное сглаживание под волатильность
  • Flexible Zone Width Adjustment Гибкая настройка ширины зоны
$50 single accessодин индикатор Get accessДоступ →
BTC Sell Zone signalsignal

BTC Sell ZoneBTC Sell Zone

Zone for Profitable Bitcoin SalesЗона для выгодных продаж Биткоина

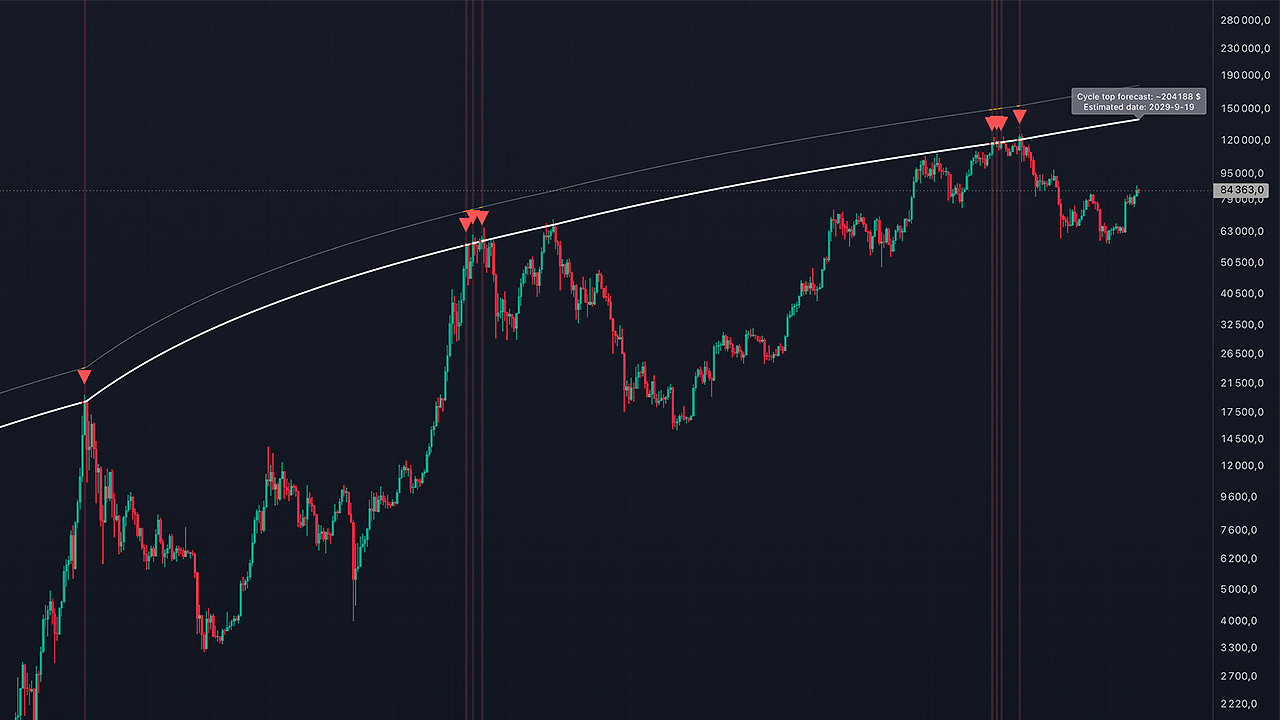
The indicator highlights an area on the chart where, historically, the best conditions for selling Bitcoin have emerged. It helps assess the current price in the context of the market and identify moments when selling the asset or closing long positions will yield the greatest profit.Индикатор выделяет на графике зону, в которой исторически формировались лучшие условия для продажи Биткоина. Помогает оценивать текущую цену в контексте рынка и находить моменты, когда продажа актива или закрытие лонговых позиций принесут наибольшую прибыль.

  • Sale Signal Indicators Индикация сигналов на продажу
  • Highlighting the area when a signal appears Подсветка области при появлении сигнала
  • Flexible zone accuracy settings Гибкая настройка точности зоны
  • An information tag showing the projected price Информационная метка с прогнозом цены
$50 single accessодин индикатор Get accessДоступ →
Trend Line trendtrend

Trend LineTrend Line

Trend Direction LineЛиния для определения тренда

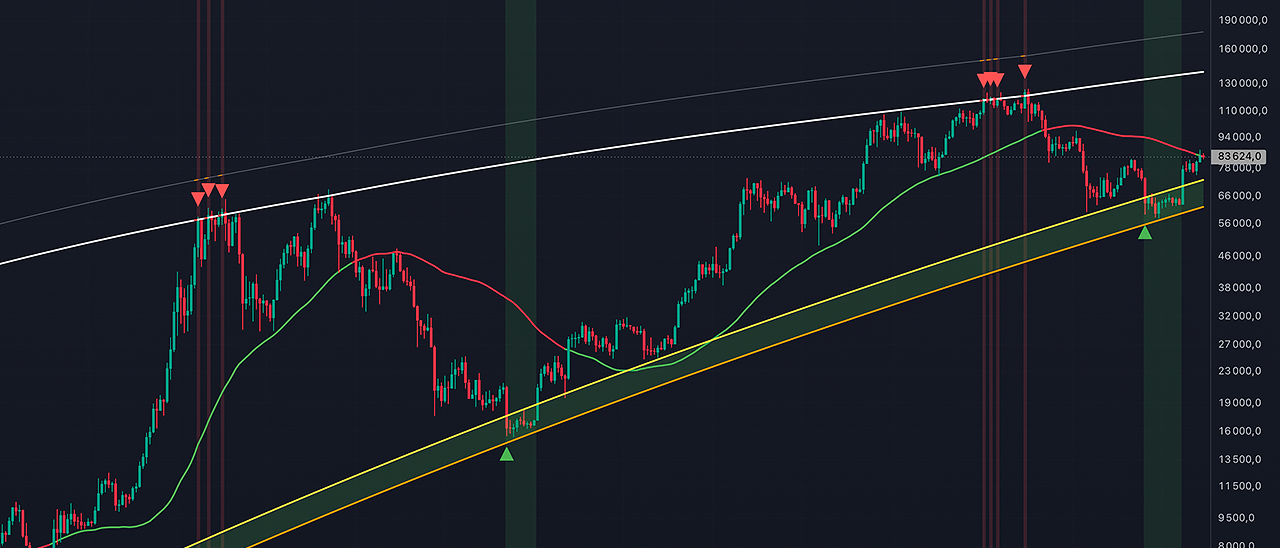
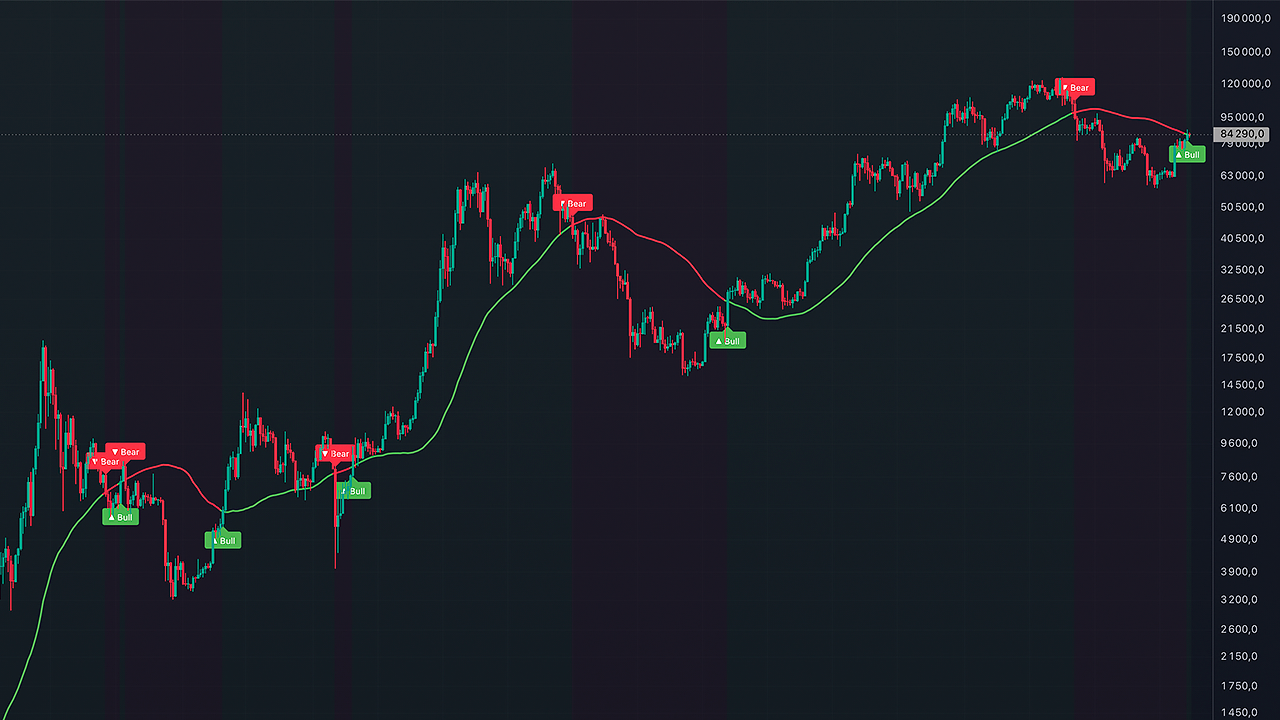
The best visual trend line for investors. It helps you see the direction of the market. In bull markets, the trend line acts as support; in bear markets, it acts as resistance.Лучшая наглядная трендовая линия для инвесторов. Помогает видеть направление рынка. На бычьих рынках трендовая линия выступает поддержкой, на медвежьих рынках сопротивлением.

  • The line changes color based on the trend Линия меняет цвет по тренду
  • Flexible parameter settings Гибкая настройка параметров
  • Trend background highlighting Подсветка фона тренда
  • Trend reversal markers Метки разворота тренда
$50 single accessодин индикатор Get accessДоступ →
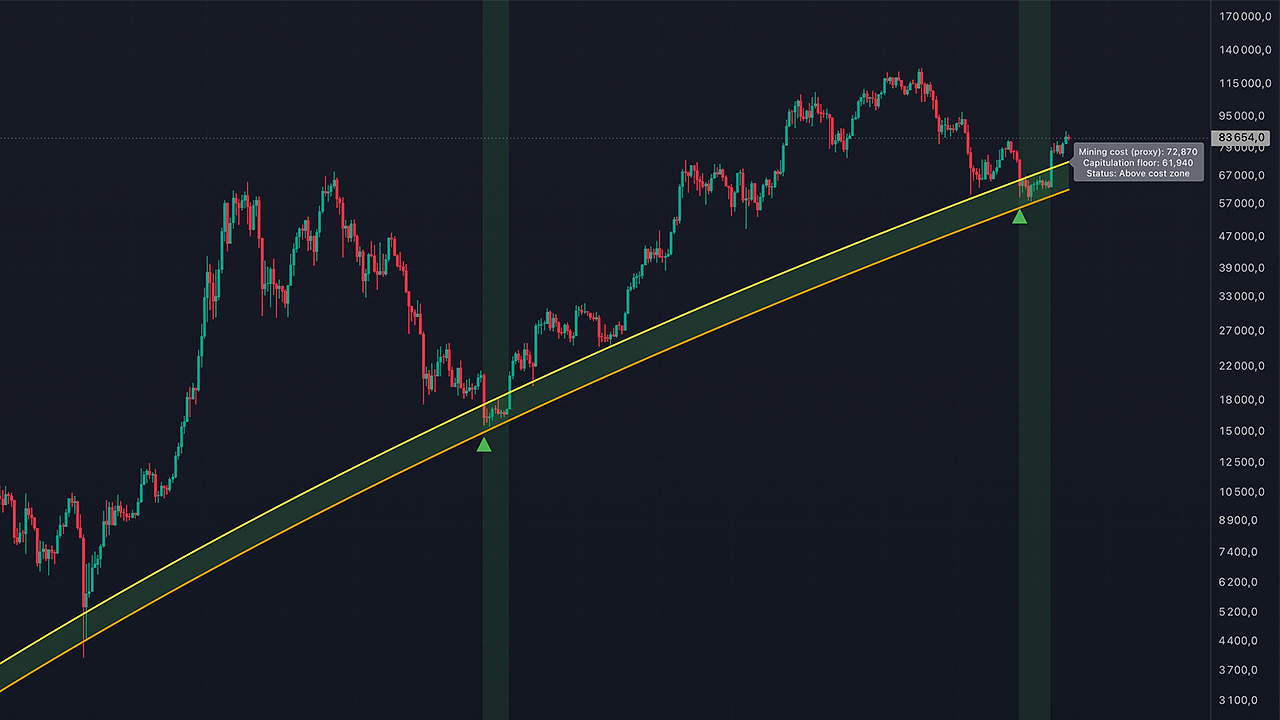
BTC Mining Cost signalsignal

BTC Mining CostBTC Mining Cost

Bitcoin Mining Break-Even ZoneЗона себестоимости майнинга Биткоина

A statistical proxy model of the break-even zone, representing a range where the upper boundary is the Bitcoin mining break-even point and the lower boundary is the point at which miners capitulate. Historically, the price has never closed below this zone.Статистическая прокси-модель зоны себестоимости представляющая из себя диапазон, в котором верхняя граница это значение себестоимости добычи Биткоина, нижняя граница это значение капитуляции майнеров. Ниже этой зоны цена исторически никогда не закрывалась.

  • Buy Signal Indication Индикация сигналов на покупку
  • Highlighting the area when a signal appears Подсветка области при появлении сигнала
  • Information label with data Информационная метка с данными
$50 single accessодин индикатор Get accessДоступ →
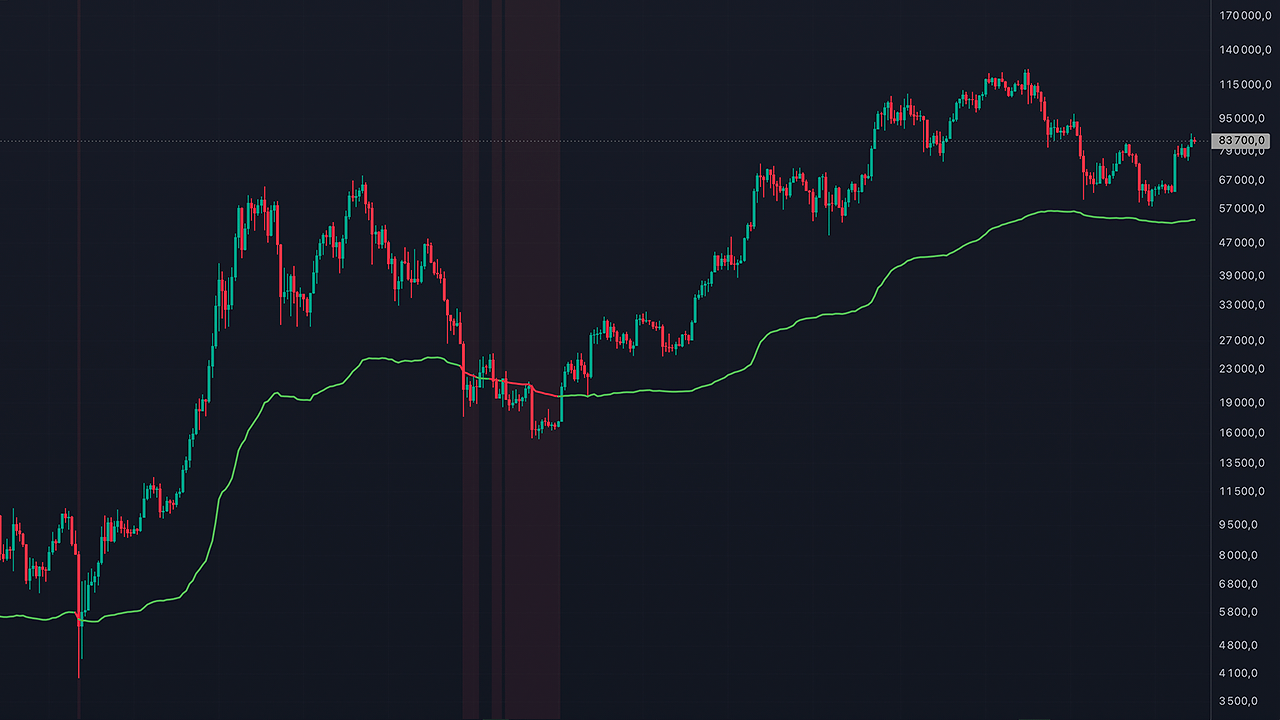
BTC Realized Price on-chainon-chain

BTC Realized PriceBTC Realized Price

Bitcoin Realized Price IndicatorИндикатор реализованной цены Биткоина

An on-chain indicator showing the average purchase price of all coins, calculated based on the value of their most recent transaction on the blockchain. When the price falls below the indicator, the average investor on the network begins to incur unrealized losses, which is a good buying opportunity.Ончейн индикатор показывающий среднюю стоимость покупки всех монет, рассчитанную по стоимости их последнего перемещения в блокчейне. Когда цена опускается ниже индикатора - среднестатистический инвестор сети начинает нести нереализованные убытки, что является хорошей зоной для покупки.

  • The line changes color depending on the situation Линия меняет цвет по ситуации
  • Background lighting when a signal appears Подсветка фона при появлении сигнала
  • Information label with data Информационная метка с данными
$50 single accessодин индикатор Get accessДоступ →
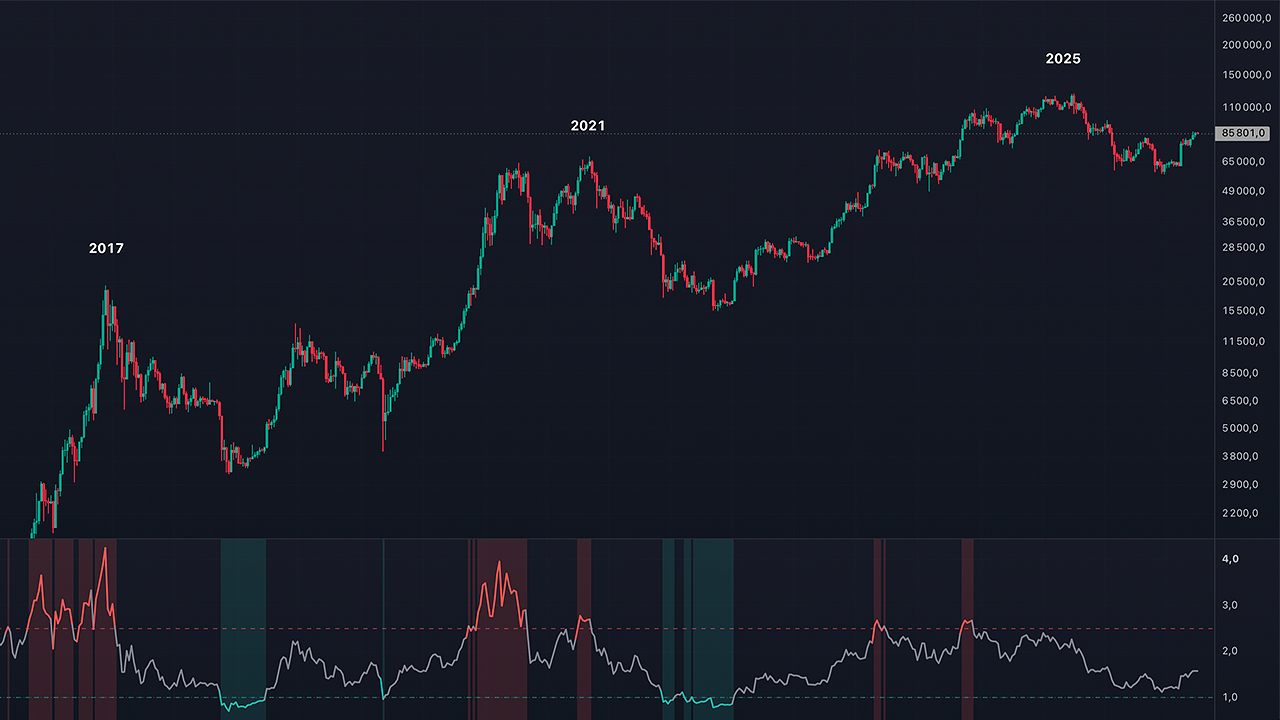
BTC MVRV on-chainon-chain

BTC MVRVBTC MVRV

Bitcoin Bottom and Overheating IndicatorИндикатор дна и перегрева Биткоина

The on-chain MVRV indicator compares Bitcoin’s market capitalization to its realized capitalization—that is, it assesses whether the market currently values the coins above or below the price at which they last traded. Low values have historically been associated with bottom zones, while high values have been associated with overheating. The indicator highlights both zones and changes the line color.Ончейн индикатор MVRV сравнивает рыночную капитализацию Биткоина с его реализованной капитализацией, то есть оценивает, насколько рынок сейчас оценивает монеты выше или ниже цены, по которой они последний раз перемещались. Низкие значения исторически связаны с зонами дна, высокие с перегревом. Индикатор подсвечивает обе зоны и меняет цвет линии.

  • MVRV line with color-coded zones: neutral, bottom, overheated Линия MVRV с цветом по зонам: нейтральная, дно, перегрев
  • Customizable lower and upper thresholds Настраиваемые нижний и верхний уровни
  • Background highlighting in zones and zone entry markers Подсветка фона в зонах и метки входа в зону
  • Alerts for entry into bottom and overheated zones Алерты на вход в зоны дна и перегрева
$50 single accessодин индикатор Get accessДоступ →
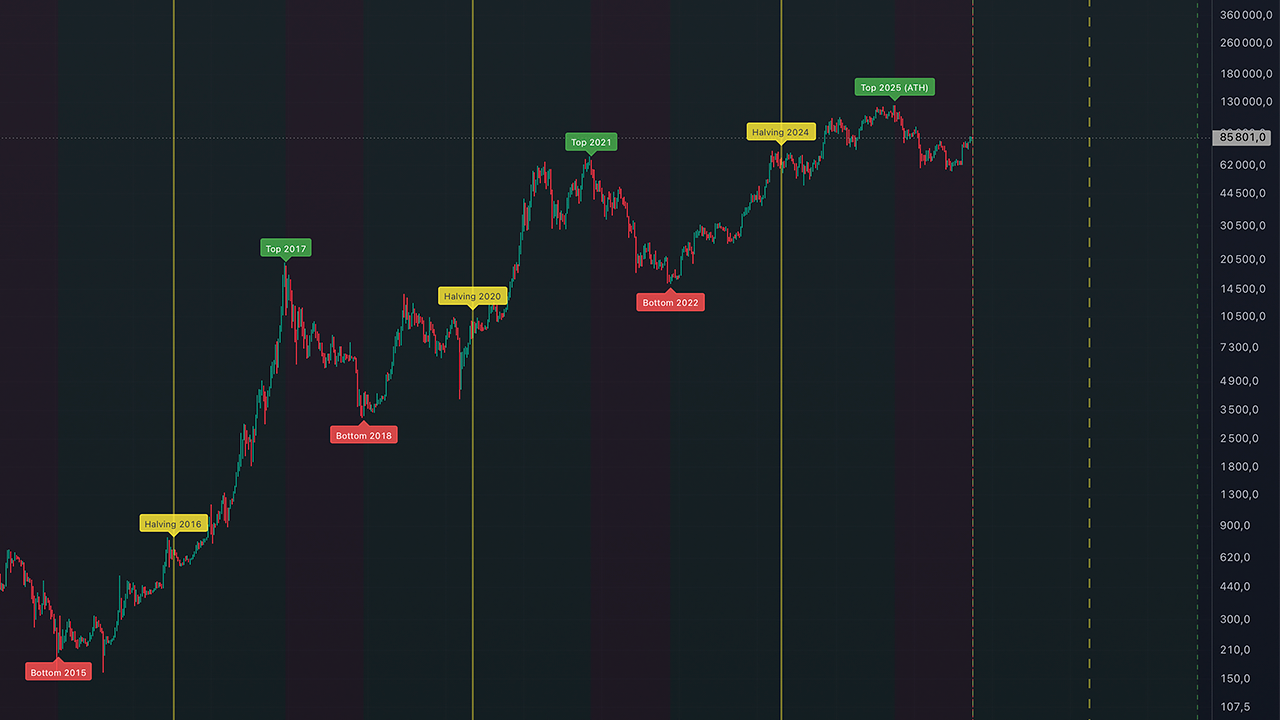
BTC Cycle Map + Halvings trendtrend

BTC Cycle Map + HalvingsBTC Cycle Map + Halvings

Bitcoin Market Cycles and Halving ChartКарта рыночных циклов Биткоина и халвингов

This indicator colors the chart according to market phases: bearish phases from peak to trough and bullish phases from trough to peak. It marks halvings, peaks, and troughs from past cycles. Based on the average duration of past phases, the indicator calculates and displays the estimated timing of the current cycle’s trough and the next peak. It helps you understand which stage of the cycle the market is in.Индикатор раскрашивает график по фазам рынка: медвежьи фазы от вершины до дна и бычьи от дна до вершины. На нём отмечены халвинги, вершины и донные значения прошлых циклов. Опираясь на среднюю длительность прошлых фаз, индикатор рассчитывает и показывает ориентировочное время дна текущего цикла и следующей вершины. Помогает понять, на каком этапе цикла находится рынок.

  • Highlighting bullish and bearish phases of the cycle Заливка бычьих и медвежьих фаз цикла
  • Vertical halving lines and an estimate of the next halving Вертикальные линии халвингов и оценка следующего халвинга
  • Labels for peaks and troughs of past cycles Подписи вершин и донных значений прошлых циклов
  • Forecast of the bottom of the current cycle and the next peak Прогноз дна текущего цикла и следующей вершины
  • Forecast of the bottom of the current cycle and the next peak Ability to customize the average length of market phases Возможность настройки средней длины фаз рынка
$50 single accessодин индикатор Get accessДоступ →
ETH Cycle Map trendtrend

ETH Cycle MapETH Cycle Map

Ethereum Market Cycle ChartКарта рыночных циклов Эфириума

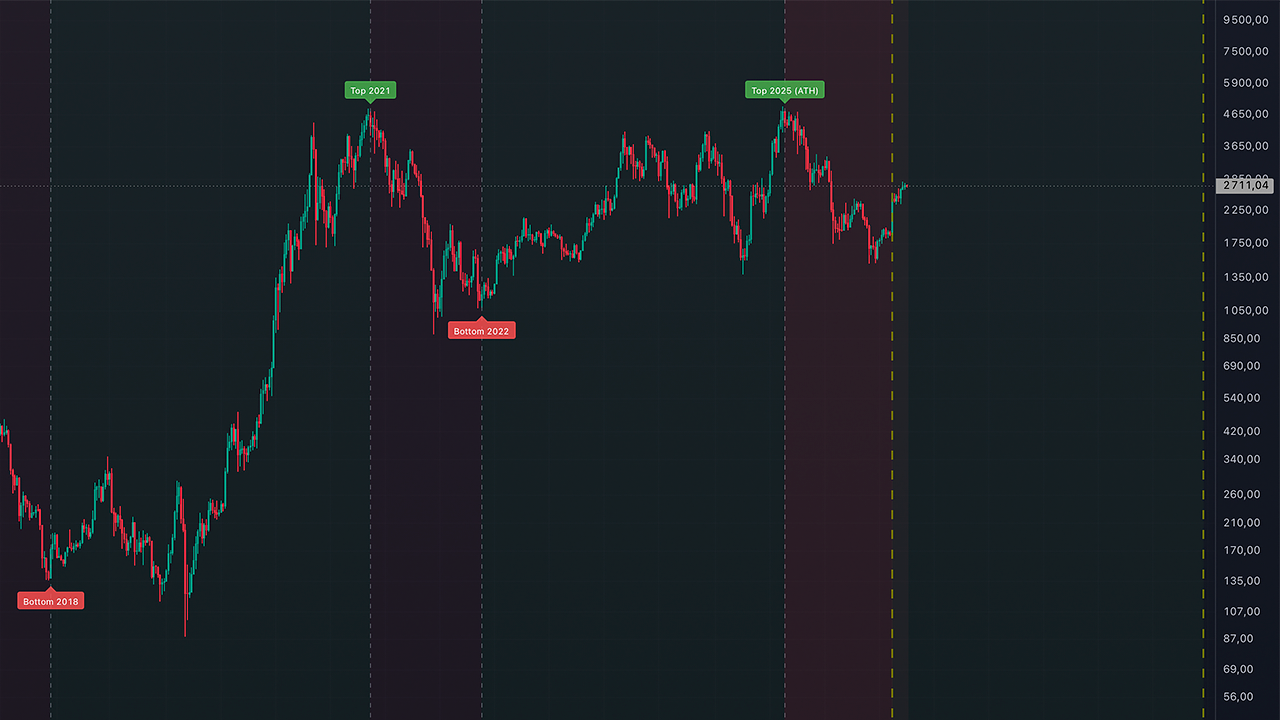
This indicator displays the bull and bear phases of past cycles on the Ethereum chart, marks their peaks and troughs, and forecasts the end of the current bear phase and the start of the next bull market. The average phase length is calculated based on past ETH cycles. Since Ethereum does not have halvings, the cycles are tied to market peaks and troughs.Индикатор показывает на графике Эфириума бычьи и медвежьи фазы прошлых циклов, отмечает их вершины и донные значения и строит прогноз конца текущей медвежьей фазы и следующего бычьего рынка. Средняя длина фаз рассчитана по прошлым циклам ETH. Халвингов у Эфириума нет, поэтому циклы привязаны к рыночным вершинам и донным значениям.

  • Highlighting bull and bear phases Заливка бычьих и медвежьих фаз
  • Vertical lines at cycle boundaries Вертикальные линии на границах циклов
  • Labels for peaks and troughs Подписи вершин и донных значений
  • Forecast of the trough of the current cycle and the next peak Прогноз дна текущего цикла и следующей вершины
  • Cycle statistics table Таблица статистики циклов
$50 single accessодин индикатор Get accessДоступ →
BTC RSI momentummomentum

BTC RSIBTC RSI

Monthly Stochastic RSI with Buy and Sell ZonesМесячный Stochastic RSI с зонами покупки и продажи

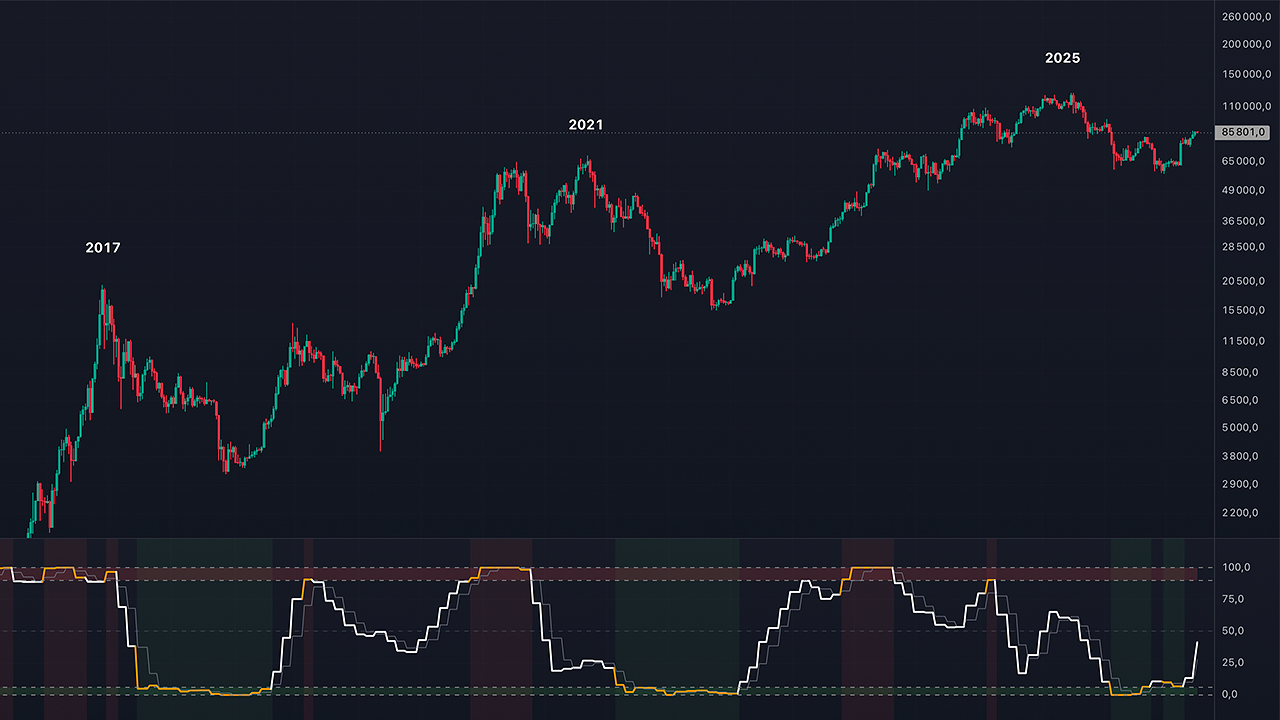
This indicator calculates the Stochastic RSI on a monthly timeframe and highlights extreme zones where Bitcoin’s historical lows and cycle peaks have occurred. It marks the extreme point within each zone. It is suitable for long-term investors, as it operates on a cycle-based scale. Signals may appear several times per cycle.Индикатор считает Stochastic RSI на месячном таймфрейме и выделяет зоны экстремумов, где за историю находились донные значения и вершины циклов Биткоина. В зоне он отмечает точку экстремума. Подходит для долгосрочных инвесторов, так как работает на масштабе цикла. Сигналы могут появляться несколько раз за цикл.

  • %K and %D lines of the monthly Stochastic RSI Линии %K и %D месячного Stochastic RSI
  • Sell and buy zones with customizable boundaries Зоны продажи и покупки с настраиваемыми границами
  • Icons at peaks and troughs within the zone Значки на вершинах и донных значениях внутри зоны
  • Chart background highlighting when entering the zone Подсветка фона графика при входе в зону
  • Option to display the standard monthly RSI for comparison Возможность показать обычный месячный RSI для сравнения
$50 single accessодин индикатор Get accessДоступ →
Liquidity Map liquidityliquidity

Liquidity MapLiquidity Map

Liquidity Zone Map on the ChartКарта зон ликвидности на графике

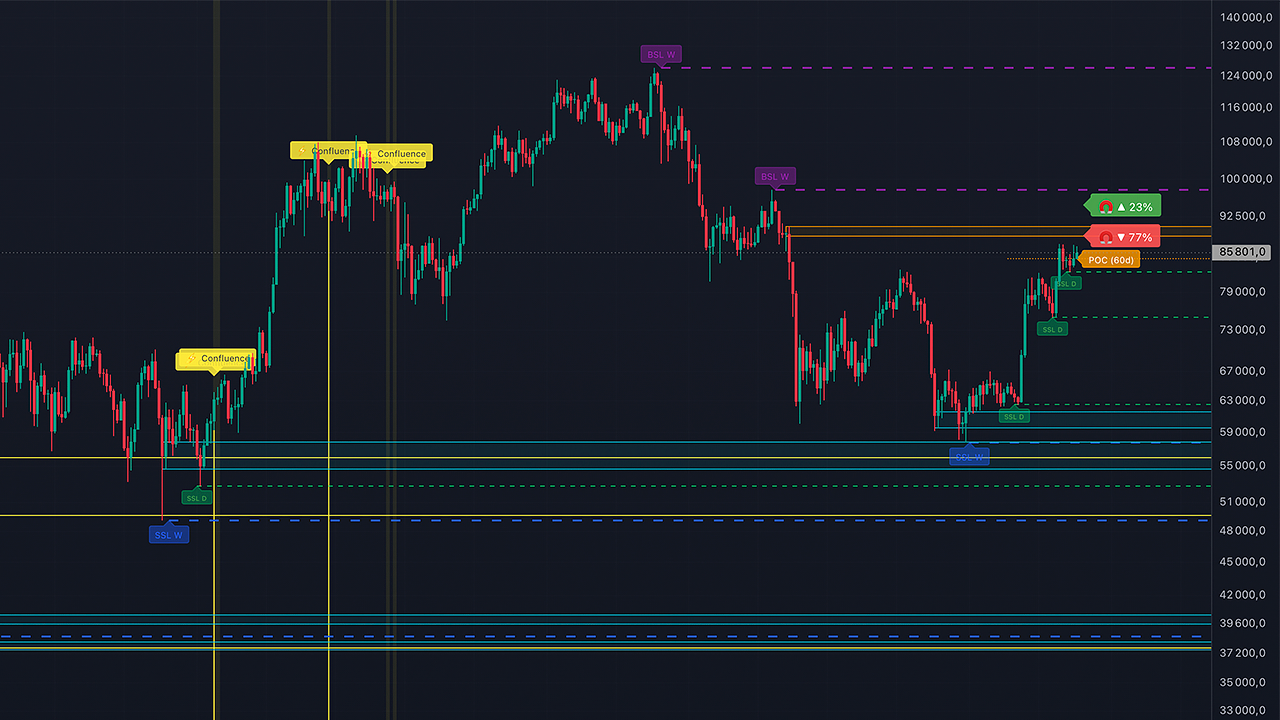
This indicator brings together in one place the levels to which the price is frequently drawn: highs and lows from higher time frames where stop orders accumulate, fair value gaps (FVG), order blocks, and the point of control (POC). If several zones coincide near the price, the indicator highlights them. This helps you see where market interest is concentrated near the price.Индикатор собирает в одном месте уровни, к которым цену часто притягивает: хаи и лои старших таймфреймов, где скапливаются стоп-ордера, разрывы справедливой стоимости (FVG), ордерблоки и точку контроля по объёму (POC). Если несколько зон совпадают рядом с ценой, индикатор подсвечивает это. Помогает видеть, где рядом с ценой сконцентрирован интерес рынка.

  • Liquidity Levels (BSL/SSL) from higher time frames Уровни ликвидности (BSL/SSL) со старших таймфреймов
  • Liquidity Levels (BSL/SSL) from higher time frames FVG Zones and Order Blocks Зоны FVG и Order Blocks
  • Volume POC Level for the selected period Уровень POC по объёму за выбранный период
  • Highlighting of zone convergence and a separate marker for strong convergence Подсветка слияния зон и отдельная отметка сильного слияния
  • “Magnet”: a concentration of weighted levels above and below the price «Магнит»: перевес взвешенных уровней выше и ниже цены
$50 single accessодин индикатор Get accessДоступ →
Trend Entry signalsignal

Trend EntryTrend Entry

Entry Signals Based on Moving Average CrossoversСигналы входа по пересечению скользящих средних

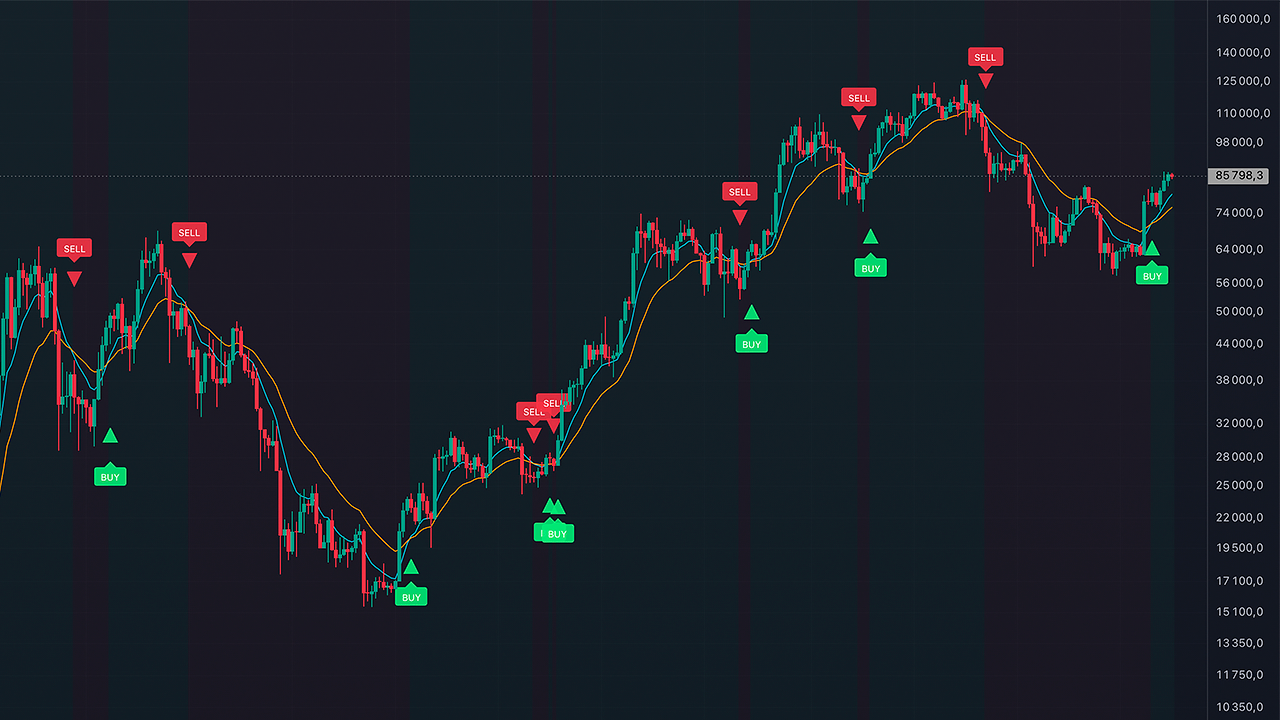
The indicator plots two moving averages on the chart—a fast one and a slow one—and marks the points where they cross. When the fast line crosses the slow line from below, a buy signal is generated; when it crosses from above, a sell signal is generated. The chart background is colored according to the current trend, so the market direction is immediately apparent. The signals confirm a trend reversal rather than predict it, and they work best in trending markets.Индикатор строит на графике две скользящие средние, быструю и медленную, и отмечает моменты их пересечения. Когда быстрая линия пересекает медленную снизу вверх, появляется сигнал на покупку, когда сверху вниз, то на продажу. Фон графика окрашивается по текущему тренду, поэтому направление рынка видно сразу. Сигналы подтверждают смену тренда, а не предсказывают её, и лучше всего работают на трендовых участках.

  • Arrows and “Buy” and “Sell” labels at crossover points Стрелки и метки «Покупрка» и «Продажа» в точках пересечения
  • Selection of the moving average type (EMA or SMA) and periods for the fast and slow lines Выбор типа средней (EMA или SMA) и периодов быстрой и медленной линий
  • Background color based on the trend direction Окраска фона по направлению тренда
  • Signal alerts Оповещения о сигналах
$50 single accessодин индикатор Get accessДоступ →
Trade Points signalsignal

Trade PointsTrade Points

Long and Short Entry Points at Adaptive BoundariesТочки входа в лонг и шорт на адаптивных границах

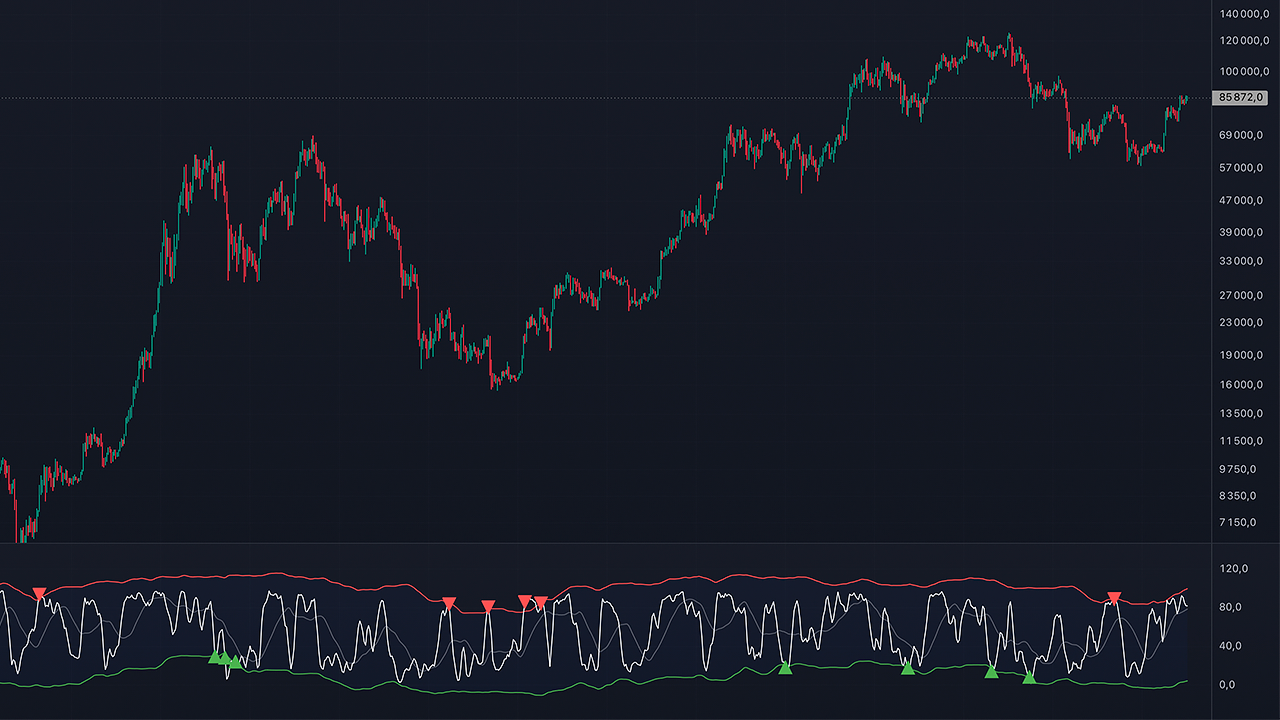
The indicator builds its own oscillator and, instead of fixed levels, uses adaptive boundaries that adjust to the oscillator’s recent range. When the oscillator crosses a boundary, a long or short icon appears on the chart. Works on any asset and timeframe.Индикатор строит собственный осциллятор и вместо фиксированных уровней использует адаптивные границы, которые подстраиваются под недавний диапазон самого осциллятора. Когда осциллятор пересекает границу, на графике появляется значок лонга или шорта. Работает на любом активе и таймфрейме.

  • Choice of oscillator: RSI or Stochastic Выбор базы осциллятора: RSI или Stochastic
  • Two methods for adaptive boundaries: statistical and based on high and low bands Два метода адаптивных границ: статистический и по полосам максимума и минимума
  • Long and short icons when boundaries are crossed Значки лонга и шорта при пересечении границ
  • Shading of the area between the boundaries Заливка зоны между границами
$50 single accessодин индикатор Get accessДоступ →
Div Hist Classic momentummomentum

Div Hist ClassicDiv Hist Classic

Divergences on the Histogram: Classic SettingsДивергенции на гистограмме: классические настройки

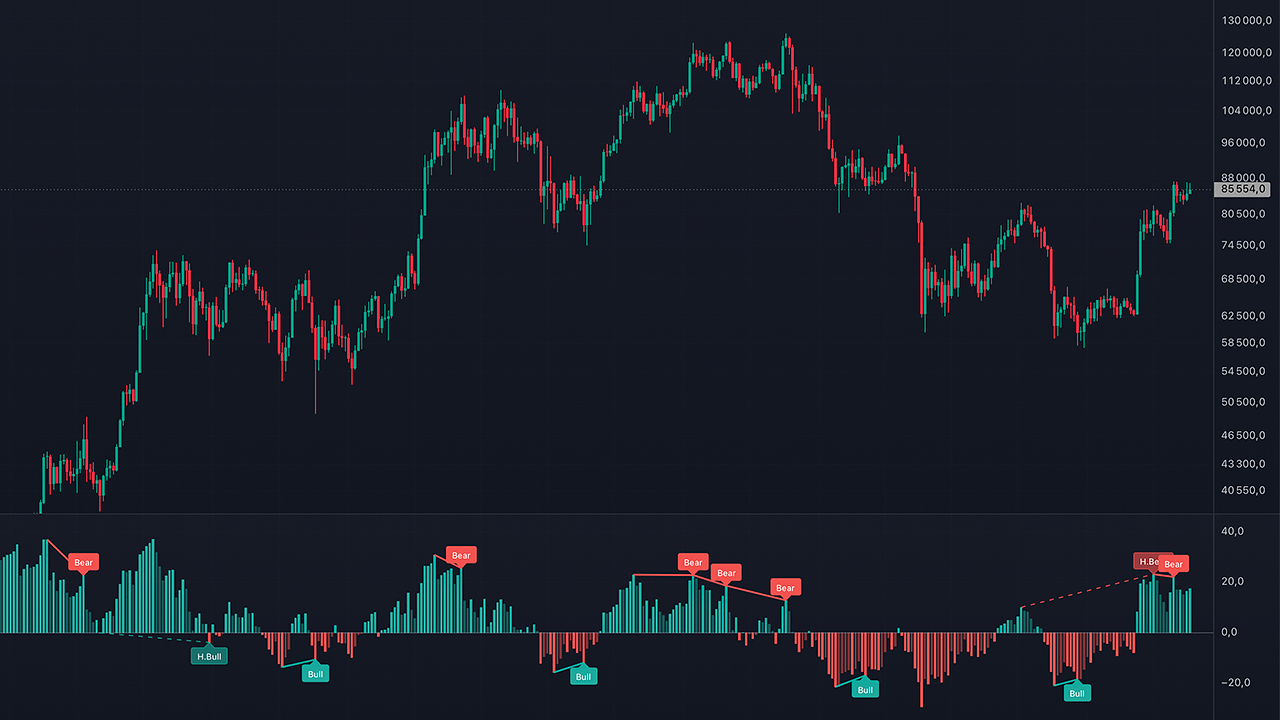
The indicator displays an oscillator histogram and automatically identifies divergences — that is, discrepancies between price movement and the oscillator — which often precede reversals. The basic version uses standard settings: a 14-period RSI according to Welles Wilde (relative to the 50 level) and a 12/26/9 MACD according to Gerald Appel. It is suitable for those who value proven standard parameters and less frequent but reliable signals.Индикатор показывает гистограмму осциллятора и автоматически находит дивергенции, то есть расхождения между движением цены и осциллятора, которые часто предшествуют разворотам. Базовый вариант использует общепринятые настройки: RSI с периодом 14 по Уэллсу Уайлдеу (относительно уровня 50) и MACD 12/26/9 по Джеральду Аппелю. Подходит тем, кому важны проверенные стандартные параметры и более редкие, но спокойные сигналы.

  • Choice of histogram: RSI, MACD, or Momentum Гистограмма на выбор: RSI, MACD или Momentum
  • Standard bullish and bearish divergences with labels and lines Обычные бычьи и медвежьи дивергенции с метками и линиями
  • Hidden divergences (can be enabled separately) Скрытые дивергенции (включаются отдельно)
  • Classic settings: RSI 14, MACD 12/26/9 Классические настройки: RSI 14, MACD 12/26/9
  • Divergence alerts Алерты на дивергенции
$50 single accessодин индикатор Get accessДоступ →
Div Hist Custom momentummomentum

Div Hist CustomDiv Hist Custom

Divergences on the Histogram: Accelerated SettingsДивергенции на гистограмме: ускоренные настройки

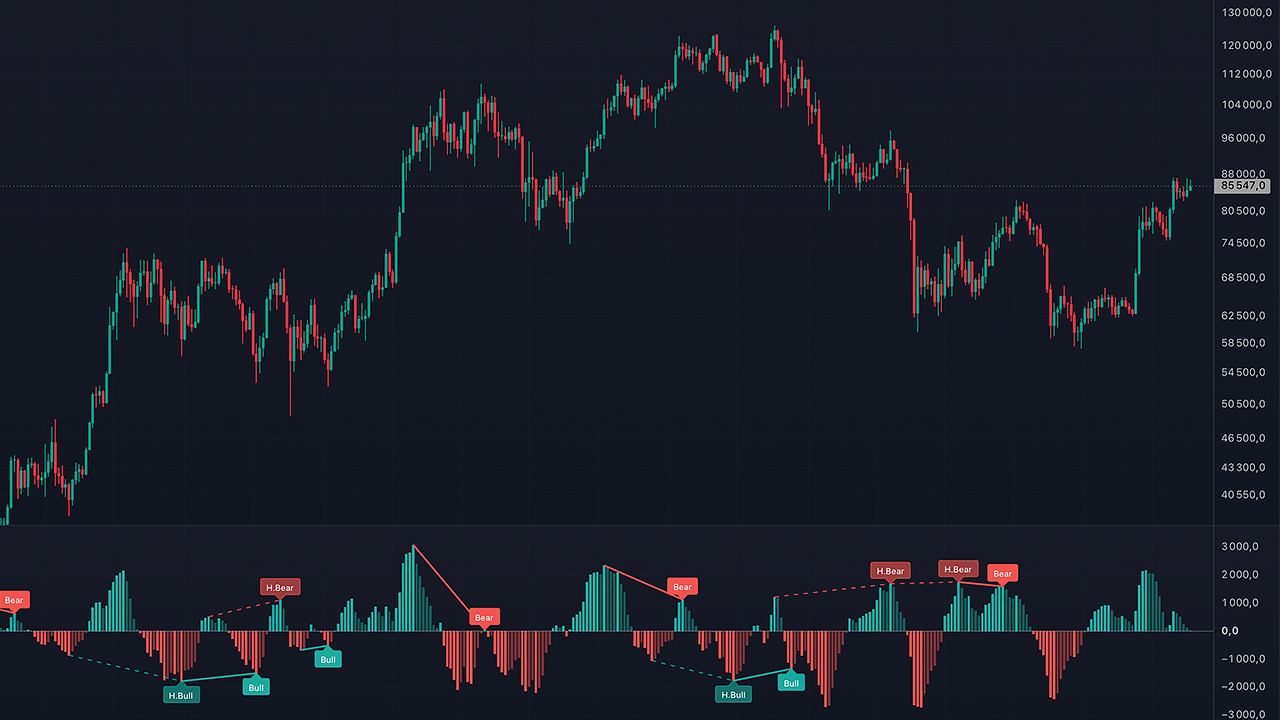
A version of the same indicator with faster settings: MACD 8/17/9 instead of the classic 12/26/9. The oscillator reacts to price movements more quickly, so divergences appear earlier and more frequently. This indicator generates more frequent signals. Suitable for a more sensitive search for reversals.Версия того же индикатора с быстрыми настройками: MACD 8/17/9 вместо классических 12/26/9. Осциллятор реагирует на движение цены быстрее, поэтому дивергенции появляются раньше и чаще. Данный индикатор даёт более частые сигналы. Подходит для более чувствительного поиска разворотов.

  • MACD histogram with accelerated parameters 8/17/9 Гистограмма MACD с ускоренными параметрами 8/17/9
  • Regular and hidden divergences with labels and lines Обычные и скрытые дивергенции с метками и линиями
  • Option to switch to RSI or Momentum Возможность переключиться на RSI или Momentum
  • Flexible configuration of pivot points and the distance between them Гибкая настройка пивотов и расстояния между ними
  • Divergence alerts Алерты на дивергенции
$50 single accessодин индикатор Get accessДоступ →
BTC Big Money signalsignal

BTC Big MoneyBTC Big Money

Large-Scale Capital Flows Based on Bitcoin’s Volume and PriceПоток крупных денег по объёму и цене Биткоина

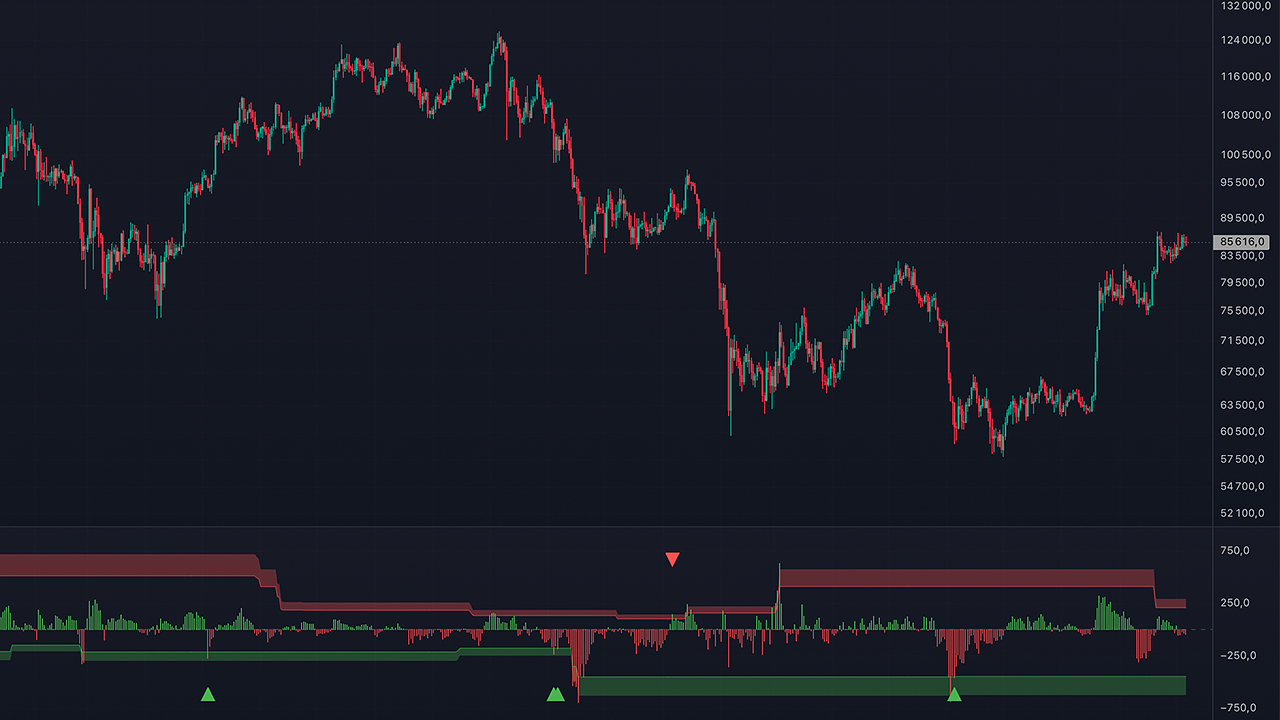
This indicator assesses buyer and seller pressure based on volume and price level. Adaptive and fixed zones are calculated around the price level; when these zones are crossed, signals of a potential top or bottom appear. This is a mathematical assessment based on price and volume, not direct tracking of wallets.Индикатор оценивает давление покупателей и продавцов по объёму и положению цены. Вокруг неё рассчитываются адаптивные и фиксированные зоны, при пересечении которых появляются сигналы возможного хая или дна. Это математическая оценка по цене и объёму, а не прямое отслеживание кошельков.

  • Money flow histogram with color-coded sign Гистограмма потока денег с цветом по знаку
  • Two zone modes: fixed and moving bands Два режима зон: неподвижные и подвижные полосы
  • Triangles indicating sell signals at highs and buy signals at lows Треугольники продажи на хае и покупки на дне
  • Additional filter based on BTC dominance Дополнительный фильтр по доминации BTC
  • Adjustable smoothing and zone width Настройка сглаживания и ширины зон
$50 single accessодин индикатор Get accessДоступ →
BTC ALTS Money liquidityliquidity

BTC ALTS MoneyBTC ALTS Money

Where Is the Money Going: Into Bitcoin or AltcoinsКуда идут деньги: в Биткоин или в альткоины

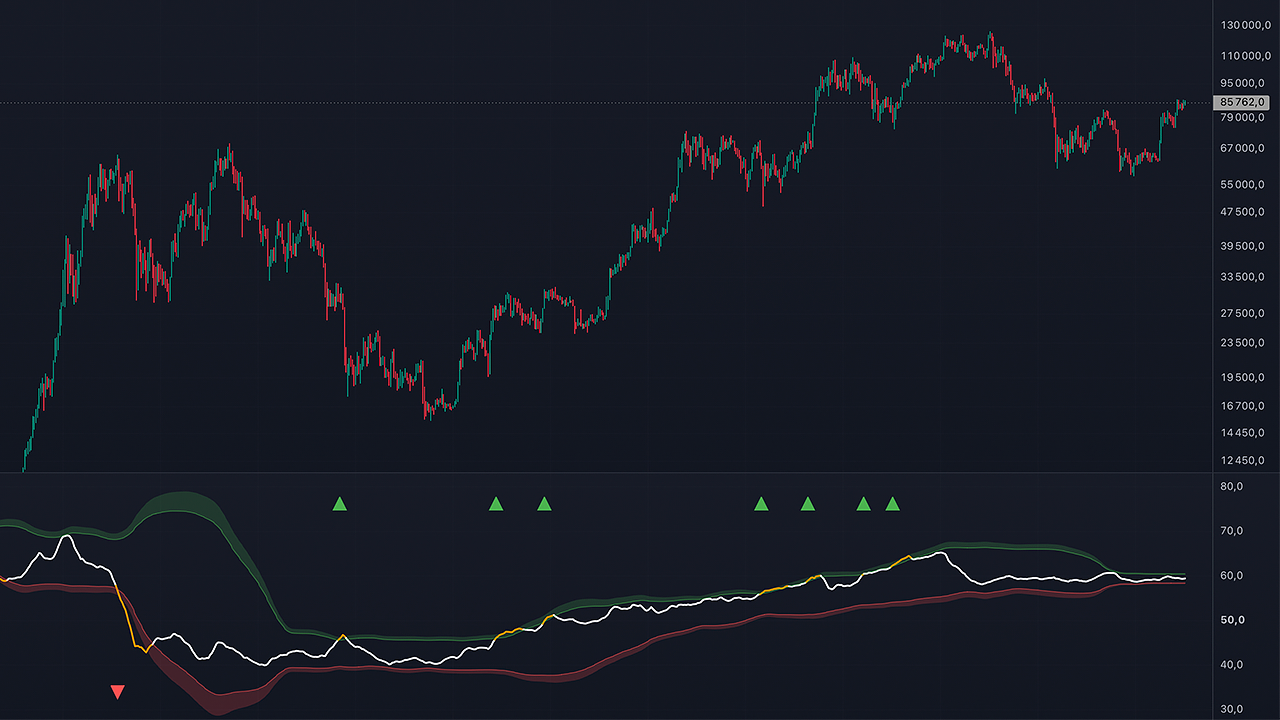
This indicator analyzes Bitcoin dominance and builds adaptive zones around it. When dominance moves into the upper zone, it signals an inflow of money into BTC and a period of accumulation; when it moves into the lower zone, it signals a shift toward altcoins and a reason for caution. It helps determine which stage of the market cycle capital is currently in.Индикатор анализирует доминацию Биткоина и строит вокруг неё адаптивные зоны. Выход доминации в верхнюю зону означает приток денег в BTC и период накопления, в нижнюю зону означает перетекание в альткоины и повод для осторожности. Помогает понять, на каком этапе рыночного цикла находится капитал.

  • Smoothed BTC dominance line Линия доминации BTC со сглаживанием
  • Adaptive upper and lower zones Адаптивные верхняя и нижняя зоны
  • Highlighted “money into BTC” and “money into altcoins” zones Подсветка зон «деньги в BTC» и «деньги в альты»
  • Accumulation and caution triangles Треугольники накопления и осторожности
  • Adjustable smoothing and zone width Настройка сглаживания и ширины зон
$50 single accessодин индикатор Get accessДоступ →
Trading Channel signalsignal

Trading ChannelTrading Channel

Trading channel with signals for long and short positionsТорговый канал с сигналами на лонг и шорт

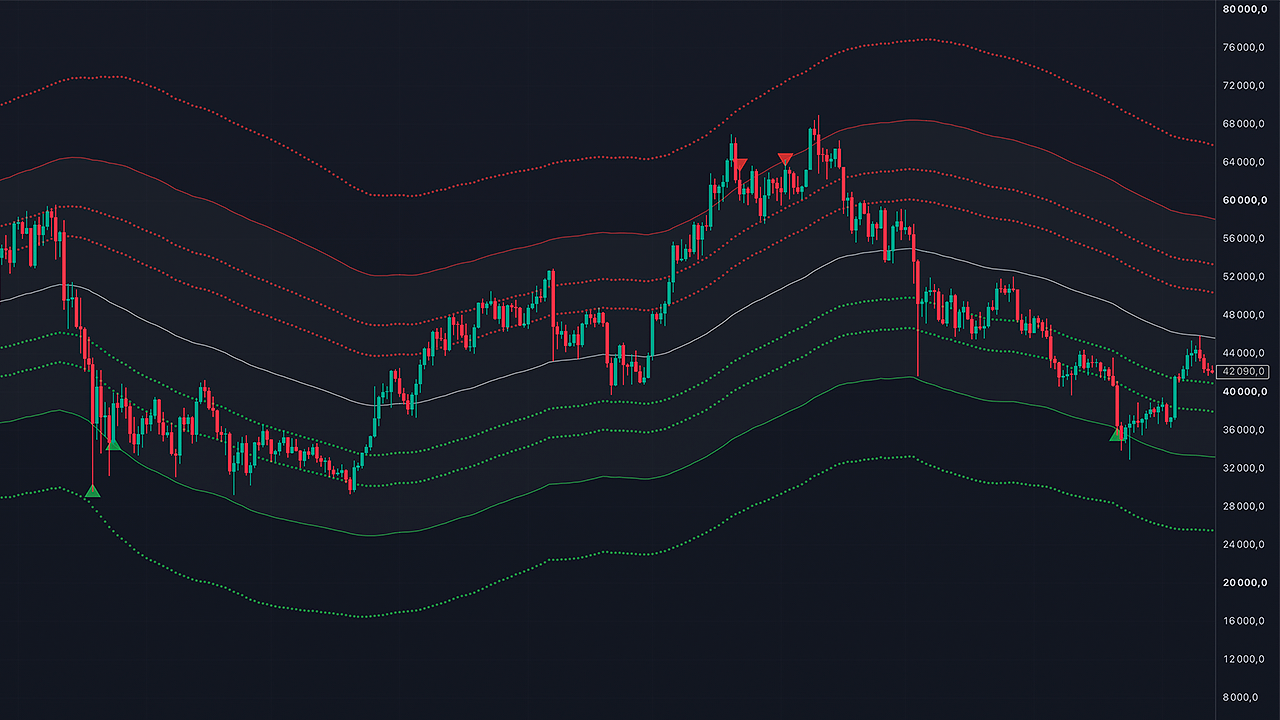
The indicator builds a channel around the midline that adjusts to market volatility. A short signal appears at the upper boundary, and a long signal at the lower boundary. The channel width can be calculated in three ways: using ATR, standard deviation, or Fibonacci levels. To reduce the number of signals and minimize false signals, there is a “bounce” mode (the wick touches the boundary, but the candle closes inside the channel), an RSI filter, and a strong trend filter that blocks signals against the prevailing trend. Signals are confirmed by the candle close, so they are not redrawn.Индикатор строит вокруг средней линии коридор, который подстраивается под волатильность рынка. У верхней границы появляется сигнал на шорт, у нижней на лонг. Ширину канала можно считать тремя способами: по ATR, по стандартному отклонению, по уровням Фибоначчи. Чтобы сигналов было меньше, а ложных ещё меньше, есть режим «отбой» (тень коснулась границы, но свеча закрылась внутри коридора), фильтр по RSI и фильтр сильного тренда, который блокирует сигналы против движения. Сигналы подтверждаются закрытием свечи, поэтому не перерисовываются.

  • A channel with three width settings Коридор с тремя методами ширины
  • Long and short signals at the boundaries Сигналы лонг и шорт у границ
  • Three signal modes: touch, bounce, and close beyond the boundary Три режима сигнала: касание, отбой, закрытие за границей
  • Additional filters to filter out false signals Дополнительные фильтры для отсева ложных сигналов
  • ustomization of source, channel, period, colors, fill, alerts Настройка источника, канала, периода, цветов, заливки, алерты
$50 single accessодин индикатор Get accessДоступ →
Smart Channel signalsignal

Smart ChannelУмный канал

Adaptive double channel around the price with signals at the boundariesАдаптивный двойной коридор вокруг цены с сигналами у границ

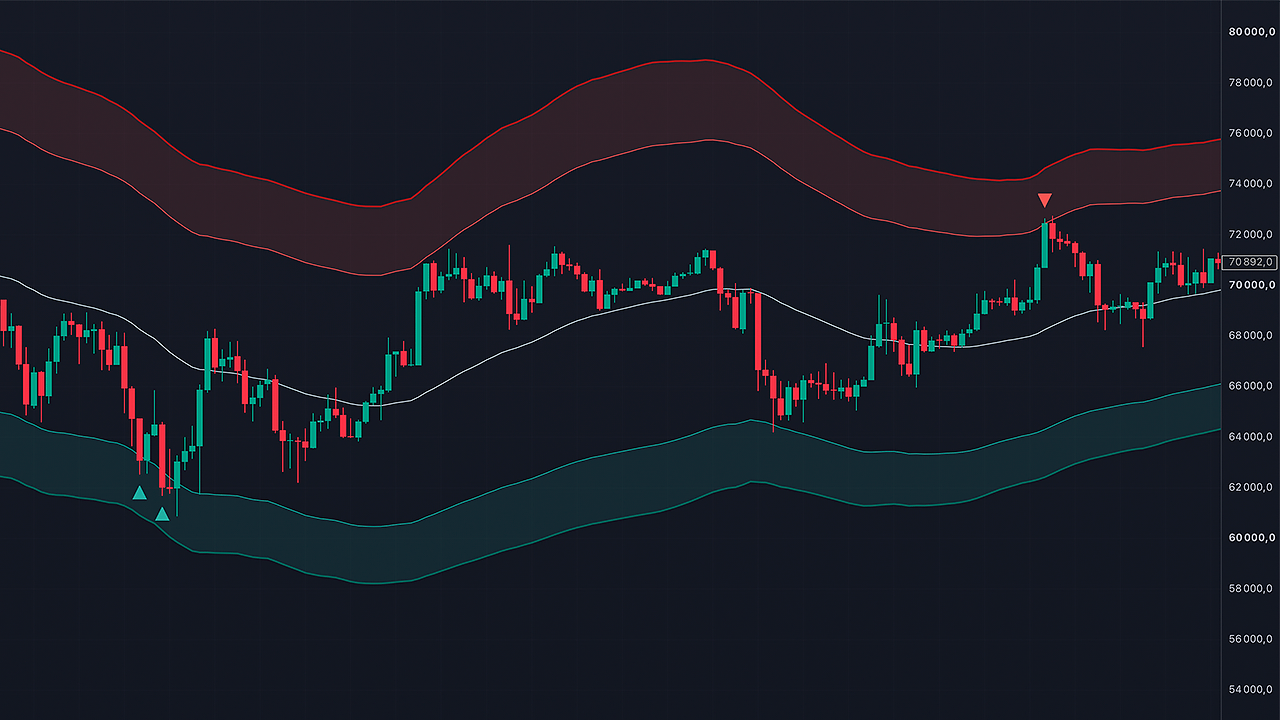
The indicator plots a smooth moving average line and two boundary levels above and below it: inner and outer. When the price breaks through a boundary, a triangle signal appears on the chart; the outer boundary indicates a stronger deviation than the inner one. The width of the channel adjusts to actual price fluctuations, and in logarithmic mode (recommended for Bitcoin), it is proportional to the price. The indicator calculates values based only on past bars and does not redraw closed candles, so you can trade based on its signals.Индикатор строит гладкую среднюю линию и два уровня границ выше и ниже неё: внутренние и внешние. Когда цена пробивает границу, на графике появляется сигнал-треугольник, при этом внешняя граница указывает на более сильное отклонение, чем внутренняя. Ширина коридора подстраивается под реальные колебания цены, а в логарифмическом режиме (рекомендуется для Биткоина) пропорциональна цене. Индикатор считает только по прошлым барам и не перерисовывает закрытые свечи, поэтому по его сигналам можно торговать.

  • A middle line and two boundaries on each side, with the areas between the inner and outer boundaries filled in Средняя линия и по две границы с каждой стороны, с заливкой зон между внутренней и внешней границей
  • Triangle signals when boundaries are crossed: inner and outer, with different colors and sizes Сигналы-треугольники при пересечении границ: внутренние и внешние, с разным цветом и размером
  • Selection of the method for the mathematical calculation of the channel and adjustment of the smoothness of the middle line Выбор метода для математического расчёта канала и настройка гладкости средней линии
  • Three methods for calculating the channel width (mean absolute deviation, standard deviation, ATR) and separate multipliers for the inner and outer boundaries Три метода расчёта ширины (средний модуль, стандартное отклонение, ATR) и отдельные множители для внутренних и внешних границ
$50 single accessодин индикатор Get accessДоступ →
PricingЦены

Simple and Clear PricingПростые и понятные цены

Choose one indicator or get full access to more than 17 tools and new indicators that will be released throughout the year. Pay the developer directly using cryptocurrency.Выберите один индикатор или получите полный доступ к более чем 17 инструментам и новым индикаторам, которые выйдут в течение года. Оплата напрямую разработчику, криптовалютой.

Single IndicatorОдин индикатор

Choose any one indicator from the suite. Full access, updates for that indicator, and setup support.Выберите любой один индикатор из набора. Полный доступ, обновления по нему и помощь с настройкой.

$50 /year/год
  • Any one indicator of your choice Любой один индикатор на выбор
  • 12 months of access 12 месяцев доступа
  • Updates for that indicator Обновления по этому индикатору
  • Personal setup help Личная помощь с настройкой
Get AccessПолучить доступ

Cryptocurrency · Direct Payment · No Auto-RenewalКриптовалюта · Оплата напрямую · Без автопродления

FAQВопросы

Questions, answeredВопросы и ответы

Everything you need to know before gaining access. Still have questions? Contact the developer directly.Всё, что нужно знать перед получением доступа. Остались вопросы? Напишите напрямую разработчику.

How can I use the indicators? Как я смогу пользоваться индикаторами?
You can use the indicators on your computer or smartphone. You won't need any programming knowledge, nor will you need to download or install any apps. Вы сможете использовать индикаторы на своём компьютере или смартфоне. Вам не потребуется знания программирования, а также скачивания и установки какого-либо приложения.
How does payment work? Как устроена оплата?
Payment is made directly—without going through an automated payment system. You contact us via Telegram or email, we confirm the selected plan, and send you the payment details for payment in cryptocurrency. Once the payment is verified, you’ll gain access to the indicators. Оплата проходит напрямую — без автоматической кассы. Вы пишете в Telegram или на email, мы подтверждаем выбранный тариф и высылаем реквизиты для оплаты в криптовалюте. После проверки оплаты вы получаете доступ к индикаторам.
What does 'all future indicators' include? Что входит в «все будущие индикаторы»?
With full access, every new indicator released during the 12 months of your subscription is automatically added to your access — at no extra cost. You get the entire current set of indicators plus all new tools released during the year. При полном доступе каждый новый индикатор, который выйдет в течение 12 месяцев вашей подписки, автоматически добавляется к вашему доступу — без доплат. Вы получаете весь текущий набор индикаторов плюс все новые инструменты, которые выйдут в течение года.
What kind of support do I get? Какая поддержка мне полагается?
You receive direct, personalized support from the author: help with configuring indicators, as well as answers to questions about how the tools work. Subscribers to the full package receive priority support. Вы получаете прямую личную поддержку от автора: помощь с настройкой индикаторов, а также ответы на вопросы по работе инструментов. Подписчики полного набора получают приоритетную поддержку.
Is this financial advice? Это финансовая рекомендация?
No. METIS indicators are educational tools designed to help you interpret the market. They do not tell you where or when to buy or sell, and nothing here constitutes financial advice. You always make your own decisions regarding all trades. Нет. Индикаторы METIS — это обучающие инструменты, помогающие читать рынок. Они не говорят, что где и когда покупать или продавать, и ничто здесь не является финансовой рекомендацией. Решения о всех сделках вы всегда принимаете сами.
Can I choose a single indicator, or do I need the full suite? Можно взять один индикатор или нужен весь набор?
Both options are available. A single indicator ($50 per year) provides full access to the selected tool, including updates. The full package ($300 per year) provides access to all current indicators, new releases throughout the year, and priority support. Доступны оба варианта. Один индикатор ($50 в год) даёт полный доступ к выбранному инструменту, включая обновления. Полный набор ($300 в год) открывает доступ ко всем текущим индикаторам, новым релизам в течение года и приоритетной поддержке.
Get AccessПолучить доступ

Ready to add new tools to your trading strategy?Готовы добавить новые инструменты в свою торговлю?

Choose a single indicator or the full package. Access is granted manually after payment is made directly in cryptocurrency.Выберите один индикатор или полный пакет. Доступ открывается вручную после оплаты напрямую в криптовалюте.

Still have questions? Contact us directly - we'll answer them personally.Остались вопросы? Напишите напрямую - ответим на них лично.